Colony loss context
Use state transitions, queen risk, feeding signals and varroa treatment follow-up to make loss risk visible earlier.
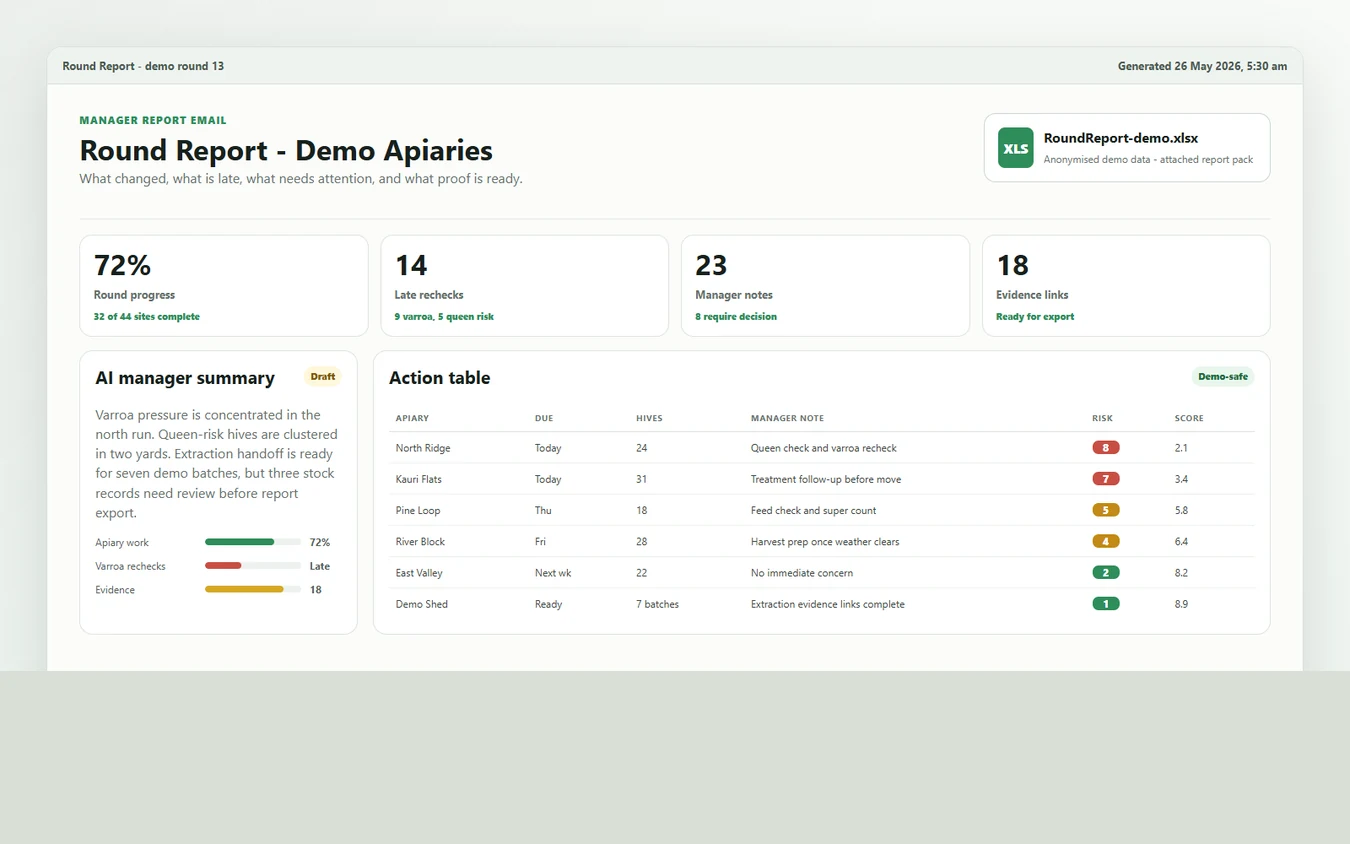
Reports
BuzzTech reports are designed for the Monday question: what changed, what needs attention now, what can wait, what proof exists, and what decision is still blocked between field work and honey proof?
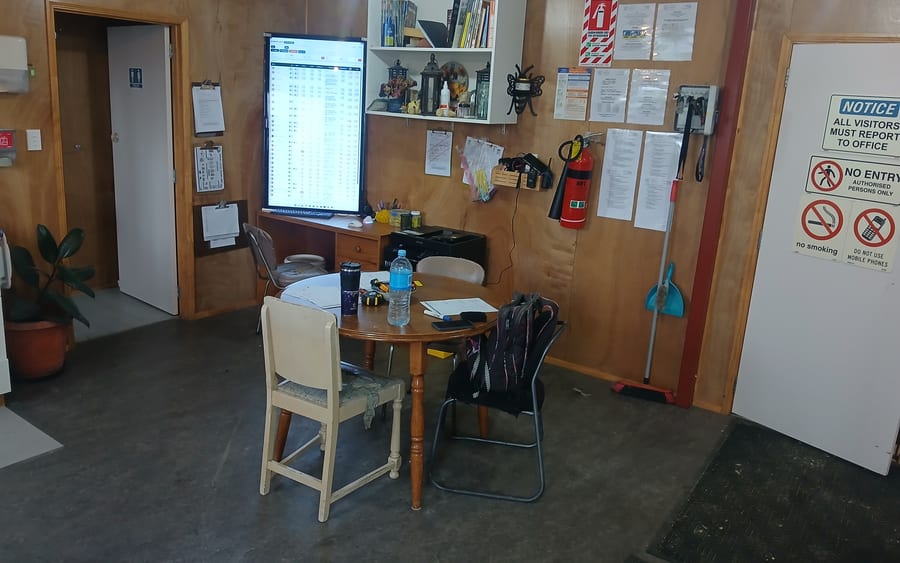
Daily team dashboard
ApiDash puts the current apiary picture where the team can see it: active sites, hive counts, app notes, treatment timing, VSH/Harbo review items, run priorities, weather windows and monitor lists. It means team meetings, lunch room conversations and field decisions start from the same up-to-date source of truth.
Friction reducerBusy teams need less asking around, fewer rebuilt spreadsheets and a faster way to agree what matters today.
Data-backed urgency
Current NZ data makes the point plainly: winter 2025 colony loss was estimated at 12.8%, Varroa was the most prominent cause, and the industry is operating with fewer hives than the boom years. The system has to surface risk earlier.
Source notes: MPI 2025 apiculture monitoring data | MPI 2025 colony loss survey | Bioeconomy Science Institute 2025 colony loss release | Newsroom 2024 hive number context.
Use state transitions, queen risk, feeding signals and varroa treatment follow-up to make loss risk visible earlier.
Fewer hives, higher costs and tighter margins make repeatable records more valuable than heroic memory.
Export, audit and customer proof depend on records that survive handover between people and systems.
Reports should create the next work plan, not merely describe the past.
| Signal | Demo result |
|---|---|
| Varroa rechecks overdue | 9 manager review |
| VSH / Harbo results | 12 hives to compare |
| Queen-risk hives | 11 unresolved |
| Production-ready hives | 86 ready |
| ECERT support printouts | 18 ready |
| Shed temperature alerts | 5 manager review |
| Extraction batches | 45 demo batches |
Demo-safePublic proof uses representative examples, fictional locations and anonymised values unless an operator approves a case study.
Priorities by site, state, action, date and crew note.
What moved from weak to recovering, queen-risk to resolved, or production-ready to harvested.
Compare Harbo score with queen source, yield, treatment history and survival.
Batch, pallet, box, weight, honey type, yield and source context.
Monitoring event, cause, action, owner, status and verification.
Temperature, chiller, warm room, hive, scale or plant event translated into work.
A short manager narrative with evidence links and unresolved decisions.
See it working
We walk through BuzzTech as it is used at Forest & Bees: round reports, crew planning, field follow-up and the systems behind the week. You see a functioning business, not a staged demo. We do not need your hive count or operational figures to show it.
Your information stays optionalThe walkthrough uses the Forest & Bees system with permission. You choose whether to discuss your own scale, locations or commercial details.